H-tortuosity (2D/3D)
Specifications:
- scalable topological descriptor; informations of different dimensions at distinct scales
random points sampling, handling disconnections and applicable on complex multi-scale microstructures, especially when entries and exits are delicate to impose
- H-tortuosity values, named H-scalars, assessing the average variations of the peripheral morphological tortuosity
- Optional step: skeletonization
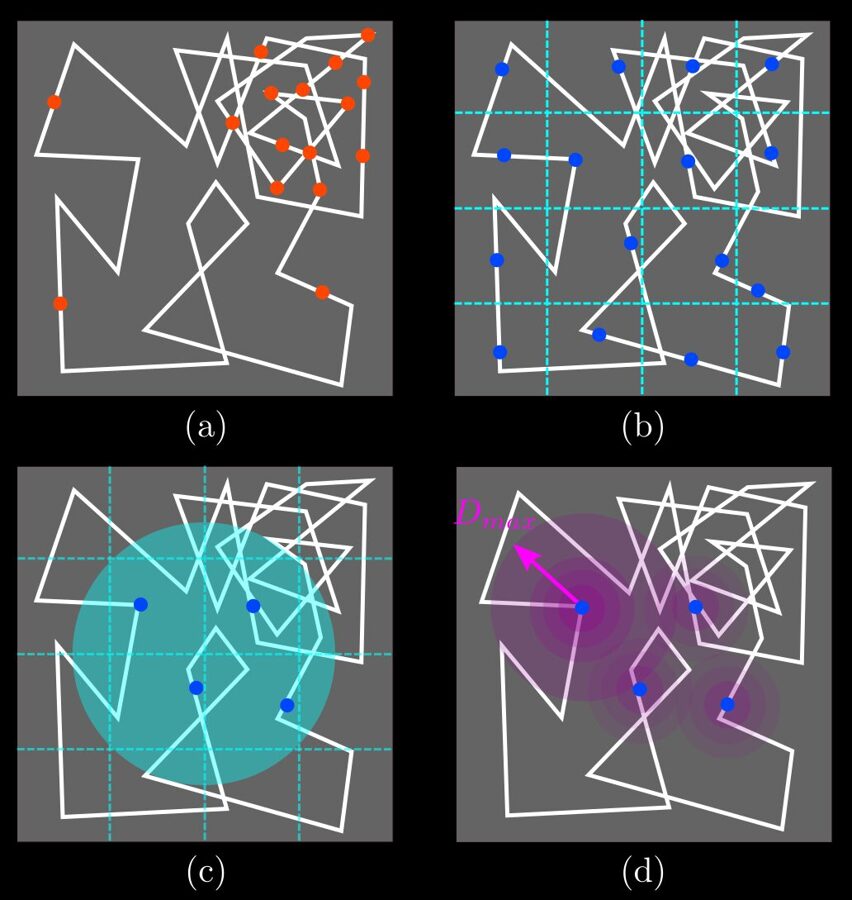
- Sampling: definition of the set of N random points; 1D-sampling method (a), stratified-sampling method
(b) (Fig.(a-b)). An additional sub-step is imposed in
the case of biphasic images, avoiding boundary issues; a sampling area is defined to remove potentially problematic points
(turquoise disk Fig.(c)).
- Distance transforms: At this step, the map of mean relative tortuosities and the maps associated to each points, if 'Save Data' checked, are computed.
- H-coefficients:
set of mean morphological tortuosities, each one connected to a
specific location, i.e. a random point, and a scale, i.e. a Euclidean
distance (shades of purple Fig.(d)).
A H-coefficient can be seen as either a viewpoint from this location at a specific distance, or the mean accessibility of this point for any other point located at this distance. - H-scalars: set of viewpoints according to a distance d (from 1 to Dmax). Contrarily to the M-tortuosity, the H-tortuosity focuses on local features by quantifying them thanks to the local variations of the morphological tortuosity.
A H-scalar, connected to a specific distance, is the mean tortuosity of a pair of random points with this distance as only constraint.
Input:
- binary microstructure
Outputs:
- H-tortuosity values (*.txt file)
- map of the mean relative tortuosities (*.fda file)
- optional: maps associated to each starting point
(*.fda file)
Parameters:
- sampling choice (1D-sampling or stratified-sampling)
- maximal distance Dmax (Fig.(d))
- number of random points N
- boolean 'Save Data', to save tortuosity maps associated to each starting point (*.fda file). Additional parameter (if checked):
- "...": selection of the save directory.